Example Usage
This page includes an extended example usage guide for using the explabox on a dataset and black-box model for multi-class classification.
![]()
Demo: Drug Review Classification
Welcome to the demo of the explabox on the UCI Drug Reviews dataset. To speed up the demo, we made a smaller subset of the train and test dataset. The demo
also includes a pretrained black-box classifier, which aims to predict whether a review in the text got a rating of
negative (1-5), neutral (5-6) or positive (6-10).
To start the demo, you require:
Python 3.8 or above (see the Python installation guide)
Jupyter Notebook installed (see the Jupyter installation guide)
An active internet connection
Install the demo via:
pip3 install explaboxpip3 install explabox-demo-drugreview
Want to follow along?
We have prepared a Jupyter Notebook for you that runs all necessary lines for the demo.
Having trouble? Want to know which functionalities the explabox includes? Check out the API reference at https://explabox.readthedocs.io/en/latest/api/explabox.html.
Let’s get started!
The Jupyter Notebook demo will walk you through importing your data and model into the explabox, and go over some examples for the explore, examine, expose and explain parts. The demo is structured as follows:
Ingestibles: importing your model and data.
Explore: exploring the dataset descriptives.
Examine: examine model behavior on the data.
Explain: explain how the model behaves in general (global) and for specific predictions (local).
Expose: find where your model is sensitive to, when it breaks down and when its behavior is unfair.
Challenges: Challenges to further
explore,examine,exposeandexplainyour ingestibles and turn them into digestibles.
1. Ingestibles
The general idea of the explabox is to turn your ingestibles into digestibles. Your ingestibles (model and data) are typically opaque and difficult to understand. They require a lot of effort to trust and understand, to test, and communicate the results of these tests. We made that a lot simpler! We have several components that turn the ingestibles into digestibles: experiments that increase the transparency of your model, and are easy to understand and share.
To get started, the explabox requires a model (e.g. a Scikit-learn classifier or a deep neural network trained in PyTorch) and the data (e.g. CSV, HDF5, Huggingface datasets or a Pandas dataframe) you want to turn into digestibles. An example of a dataset for debugging purposes is the test set of the model. The explabox has two simple functions that import the data and model for you: explabox.import_data(...) and explabox.import_model(...). For the demo, we have already provided you with the location of the dataset file (dataset_file) and imported the model for you (model):
from explabox_demo_drugreview import model, dataset_file
The UCI Drug Reviews dataset contains over 200,000 patient reviews for drugs. The dataset includes the following columns:
Column |
Description |
Data type |
|---|---|---|
|
Name of drug discussed in review |
Categorical (string) |
|
Name of condition discussed in review |
Categorical (string) |
|
Patient review |
Free text (string) |
|
10 star patient rating |
Rating |
|
Date of review entry |
Date |
|
Number of users who found the review useful |
Continuous value |
To speed up the demo, we have included a small subset of examples from the original train and test set. We made a classifier, that predicts the sentiment for each review: negative (1-5), neutral (5-6) or positive (6-10). To make the performance comparisons easier, the rating column in the example dataset has also been transformed to these three categorical values.
Let us start by importing the data, where we are interesting in the textual reviews in the 'review' column and the labels in the 'rating' column. The dataset_file is the location of the dataset (drugsCom.zip), containing a train split (drugsComTrain.tsv) and test split (drugsComTest.tsv).
from explabox import import_data
data = import_data(dataset_file, data_cols='review', label_cols='rating')
The model included has already been passed through the model = import_model(...) function for you, and can therefore be used directly. This is on purpose, so the model is a true black-box for you!
Now let’s explore/examine/expose/explain your model with the Explabox!
Make sure you explicitly include that drugsComTrain.tsv includes the train split and drugsComTest.tsv the test split of the data:
from explabox import Explabox

box = Explabox(data=data,
               model=model,
               splits={'train': 'drugsComTrain.tsv', 'test': 'drugsComTest.tsv'})
Now you are ready to .explore, .examine, .expose and .explain with the explabox!
NOTE
You can use help(...) at any time to better understand a model or function.
2. Explore
The Explorer explores your data by providing descriptive statistics. It is included in the Explabox under the .explore property.
Get descriptives for all splits by calling box.explore() or box.explore.descriptives():
box.explore()
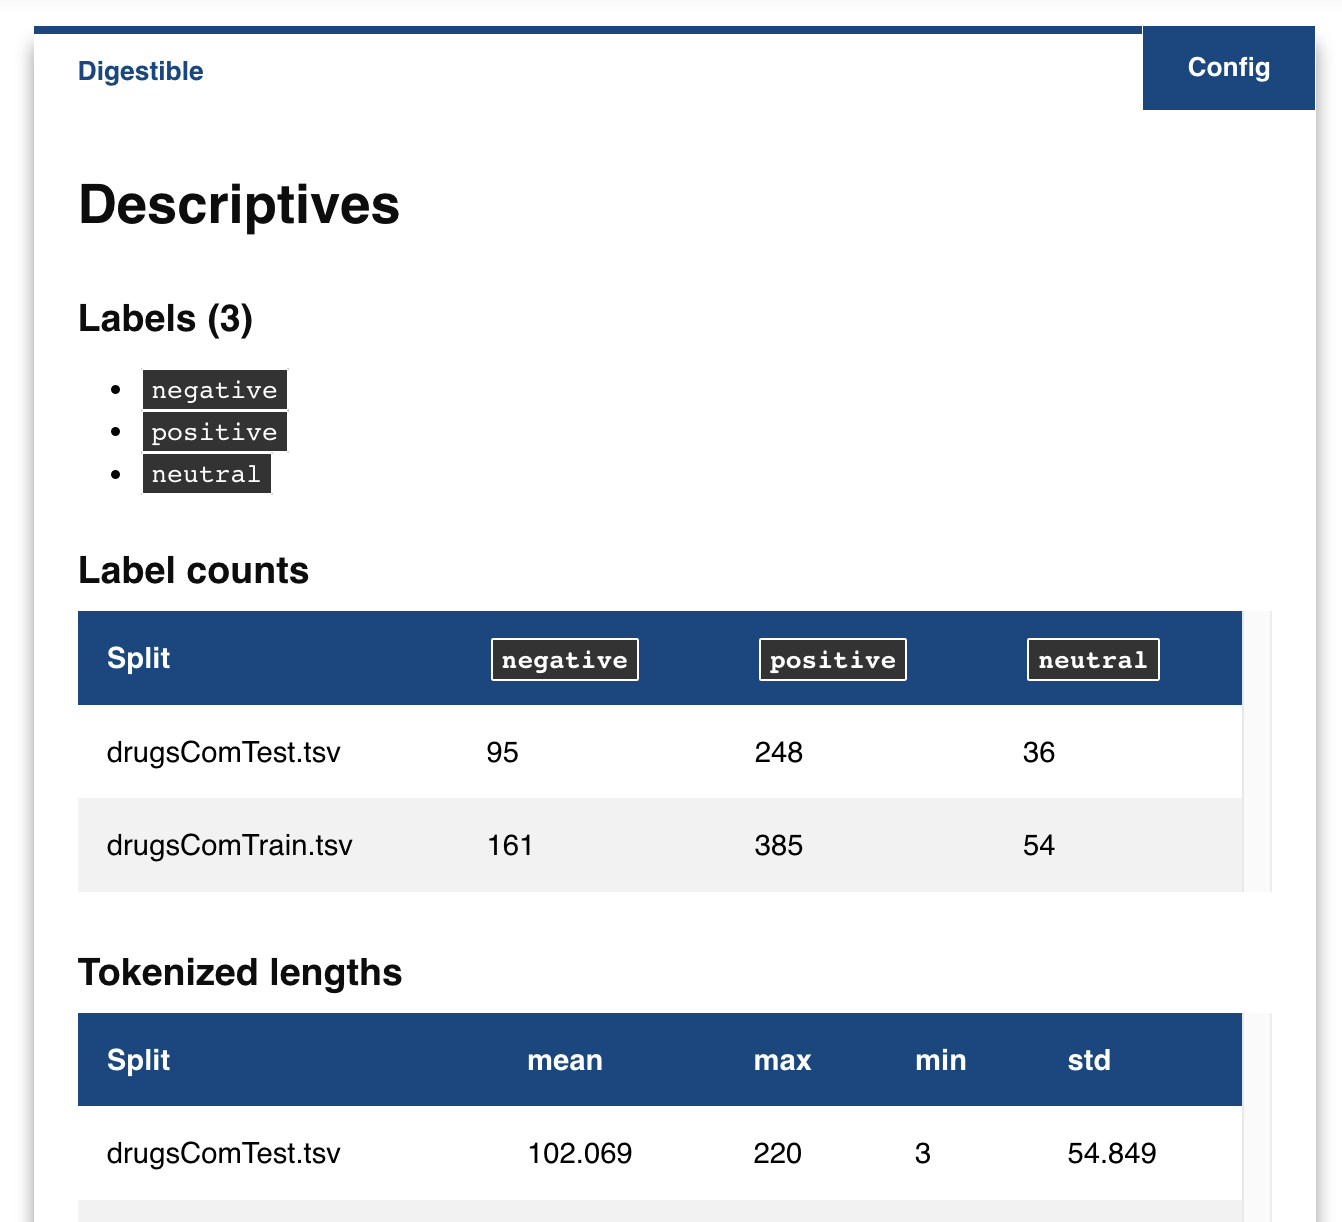
Even though we trust you could have calculated each of these yourselves, it sure saves a lot of work. One simple call and that is all there is.
Want to look at a split of the data in more detail? Try box.explore.instances():
dataset = box.explore.instances()
You can then further filter, drill-down or select you data. For instance by filtering on label ‘positive’…
dataset.filter('positive')
… or taking the first 10 elements
dataset.head(n=10)
Let’s examine (see what I did there?) for some more impressive functionalities.
3. Examine
Now we’ve got a gist of what the data looks like, how does the model perform on the data? Simple, just call box.examine() or box.examine.performance(). To do so, the Examiner requires a ‘model’ and ‘data’. It is included in the explabox under the .examine property.
box.examine(split='test')
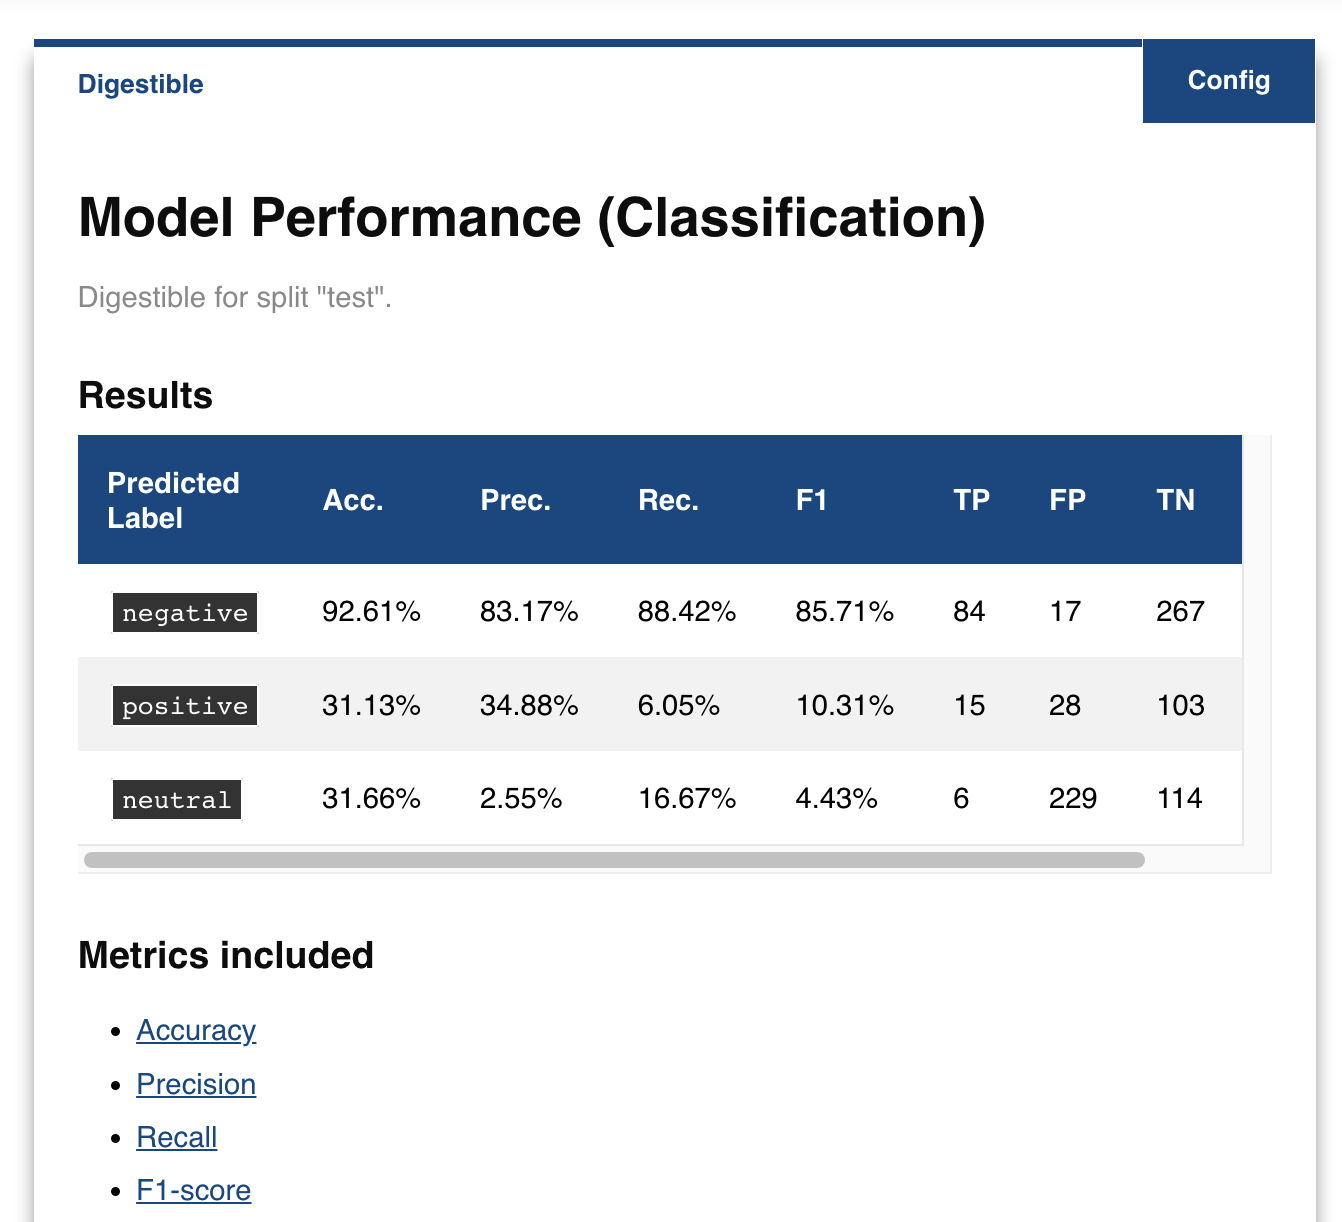
That’s some magic!
It sure is! The explabox inferred your model is a classifier, got all the dataset splits and did all the work for you. It even includes links to explain what all the metrics included mean! Some magic box, right?
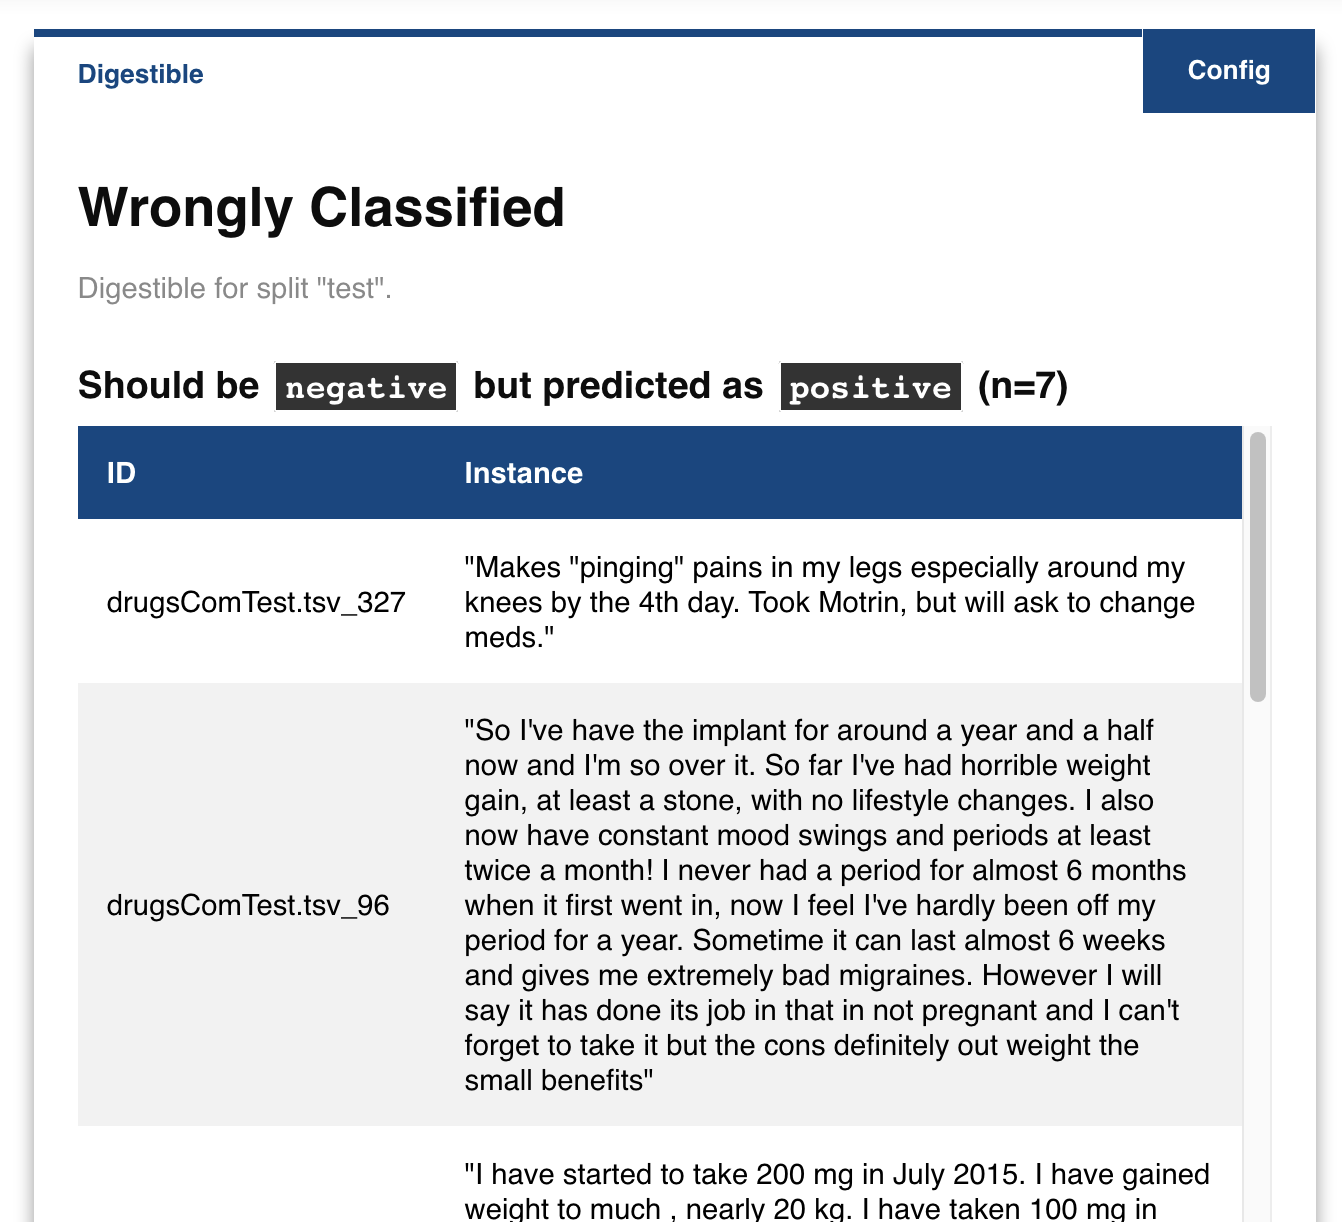
The explabox even allows us to dive deeper into where the model went wrong. Let us see which examples were wrongly classified:
box.examine.wrongly_classified()
4. Explain
So what makes the explabox so unique? Why not use one of the many other tools for generating dataset descriptives and calculating performance?
Well, the explabox doesn’t stop there! That’s just where it starts. Ever heard of explainable artificial intelligence (XAI)? We’ve included that for you!
It doesn’t matter if you use the explanations for yourself, show your end-user why a decision was made, to test an externally acquired model, or to provide model clients and supervisory authorities with the insights they require. We can help you on all of those. The explanations included are either local (providing explanations for a single prediction) or global (providing explanations for one or more dataset splits).
The Explainer creates explanations corresponding to a model and dataset (with ground-truth labels). The Explainer requires ‘data’ and ‘model’ defined. It is included in the explabox under the .explain property.
4.1 Local explanations
Why did my model predict a class label? Look no further than box.explain.explain_prediction(...):
box.explain.explain_prediction('Hate this medicine so much!')
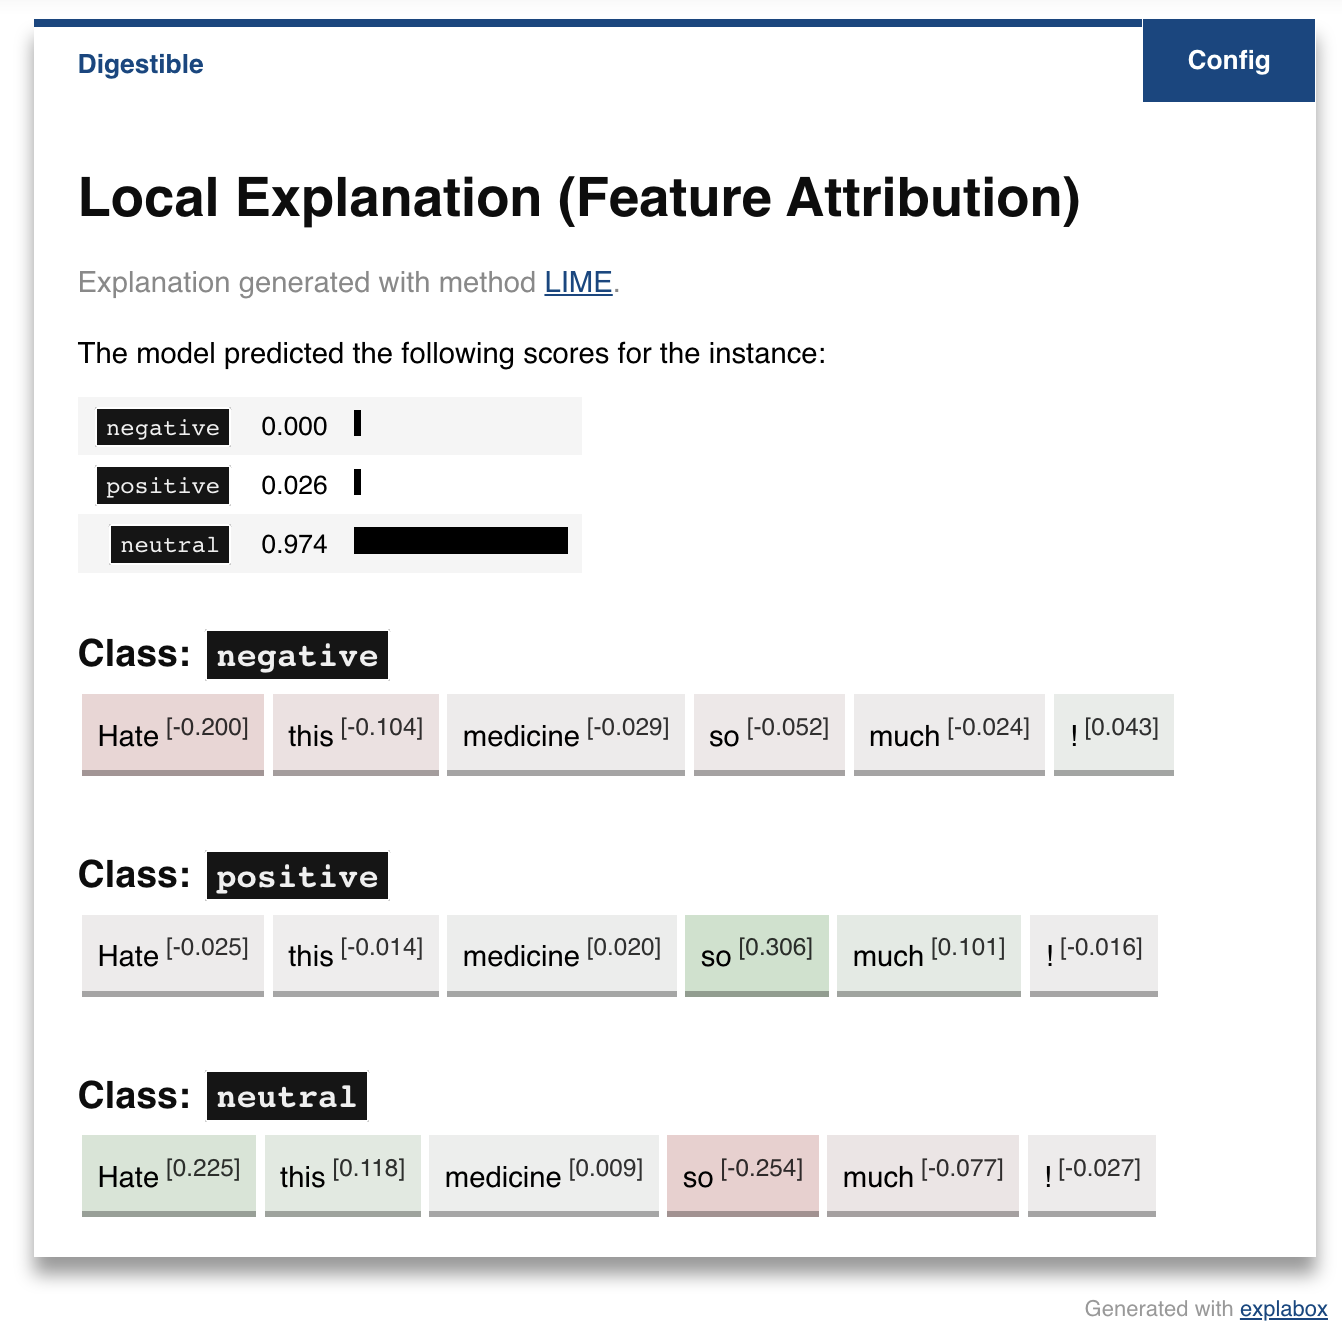
Even more magic!
We’ve got the work covered for you. Even though it is very easy to use the defaults, you can incorporate your own requirements into the function call:
Want more samples?
.explain_prediction(..., n_instances=500)Unweighed samples?
.explain_prediction(..., weigh_samples=False)Want other methods?
.explain_prediction(..., methods=['lime', 'shap', 'local_tree'])
So many options to choose from! It uses text_explainability for all these methods, which provides a generic architecture for constructing local/global explanation methods.
INFO
Want to see all options for local explanation? Check out the text_explainability documentation.
4.2 Global explanations
A lot of model behavior can be explained through the data it trained on. So, are there specific tokens corresponding to each label in the training set?
box.explain.token_frequency(splits='train', explain_model=False, labelwise=True)
We could have done the same for the 'test' split, or explaining model predictions rather than ground-truth labels (explain_model=True) or aggregating them over all labels (labelwise=False). Want to know how informative tokens are in splitting labels? Try box.explain.token_information(...).
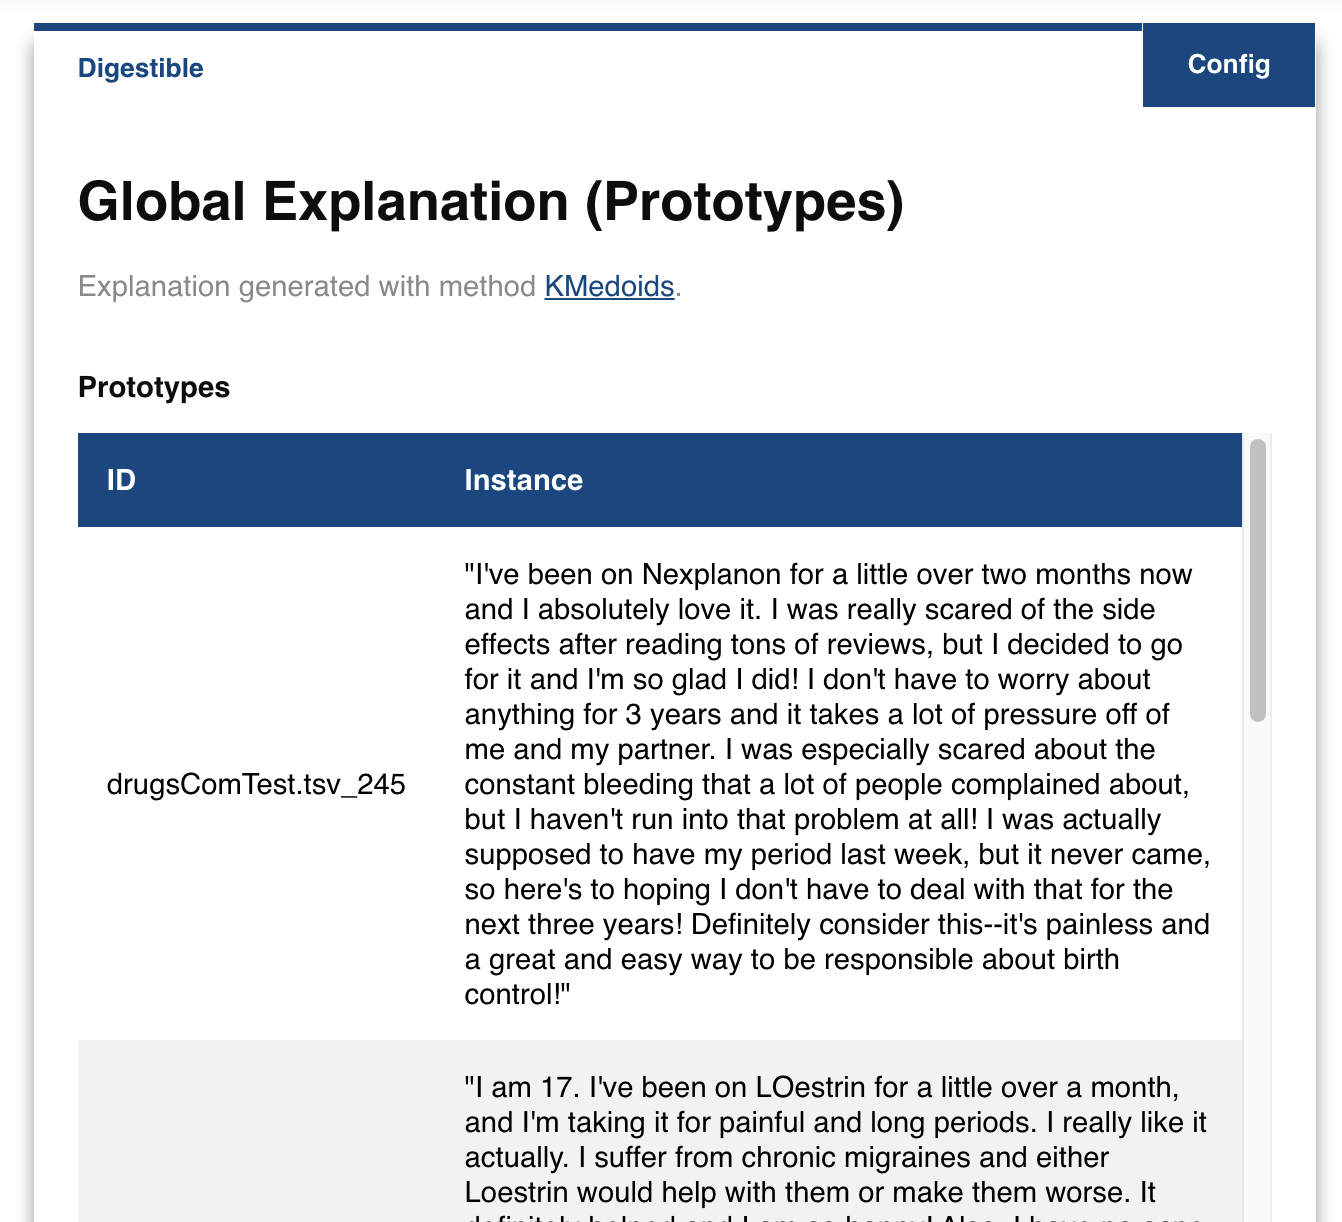
The datasets include a lot of examples. Can we summarize them in fewer examples, let’s say 5? That’s what box.explain.prototypes(...) does:
box.explain.prototypes(n=5, method='kmedoids')
Or maybe add some outliers (so-called criticisms), that are a-typical for the dataset split:
box.explain.prototypes_criticisms(n_prototypes=5, n_criticisms=3)
INFO
There are so many options for explanations, provided for text datasets by the text_explainability package. Check it out to see what is possible!
5. Expose
Last, but far from least, the Exposer exposes your model and/or data, by performing sensitivity tests. With the Exposer you can see model sensitivity to random inputs (safety), test model generalizability (robustness), and see the effect of adjustments of attributes in the inputs (e.g. swapping male pronouns for female pronouns; fairness), for the dataset as a whole (global) as well as for individual instances (local).
The Exposer requires ‘data’ and ‘model’ defined. It is included in the explabox under the .expose property.
5.1 Safety
Does your text classifier break down at some inputs? Strings it cannot parse? Instances that empty or are too long? Try exposing the input space to see its safety:
box.expose.input_space('all', min_length=0, max_length=6000)
5.2 Robustness
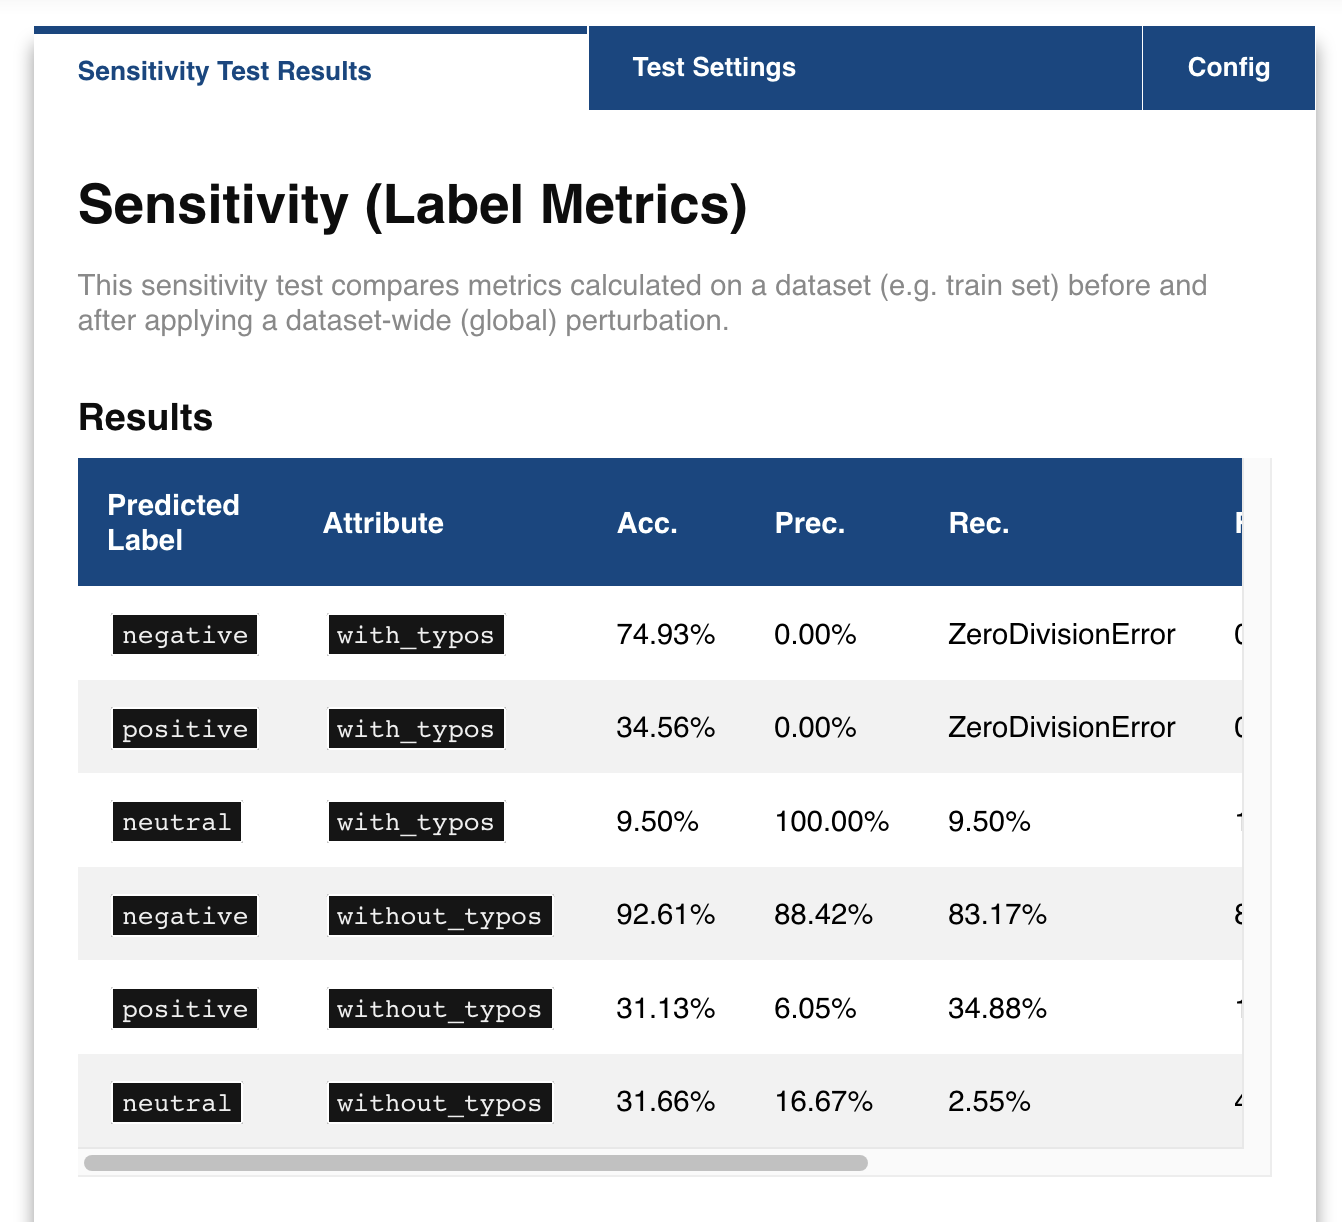
Or take a global approach by seeing what happens if you transform all instances in the ‘test’ split from their original form to uppercase:
box.expose.compare_metric(perturbation='upper')
For both functions there are many techniques to choose from. Why not try exposing the input space with only 'ascii_upper' and 'whitespace'? Or try see how introducing 'add_typos' affects your model?
box.expose.compare_metric(perturbation='add_typos')
5.2 Fairness & Robustness: pattern effects
Sometimes you need to go beyond the data to see model robustness and fairness. For the text domain, you can generate data with the text_sensitivity package and see how the models performs on them.
To do so, you write so-called patterns that generate data for you. At spots where you want some data filled in, you simply include curly braces and we fill in the data for you. For some entities (name, city, email, year, month, …) we can even generate the data for you. Patterns with a pipe (|) simply put in the values you provided. Under the hood, it uses from_pattern(...) in the text_sensitivity example usage package. Example patterns include:
Pattern
from_pattern('My phone number is {phone_number}')generates ‘My phone number is 001-364-187-2809’, ‘My phone number is +1-099-759-8699’, …Pattern
from_pattern('{upper:name} is from {city}.)'generates ‘JAMES RUSSEL is from Oklahoma City.’, ‘BRIAN WILSON is from Millermouth.’, …Pattern
from_pattern('{His|Her} favorite girl is {female_name}', female_name=RandomFirstName(sex='female'))generates ‘His favorite girl is Julia’, ‘Her favorite girl is Julia’, …
Let’s turn that generated data into a proper test, where we except that the review is positive regardless:
box.expose.invariance('My friend {name} {loves|likes} this medicine. It is amazing!',
                      expectation='positive',
                      n=10)
Or one where it is negative regardless:
box.expose.invariance('My friend {upper:first_name} {hates|dislikes} this medicine. It is{| not} terrible!',
                      expectation='negative',
                      n=2)
Or simply output the mean probabilistic score for the label negative for the generated instances:
box.expose.mean_score('My friend {first_name} from {city} {hates|dislikes} this medicine!',
                      selected_labels='negative')
NOTE
For the text domain, sensitivity tests are provided by the text_sensitivity package. Try the text_sensitivity example usage guide to get acquainted with all that is possible.
6. Challenges
Want some pointers on where to go to next? Want to further .explore, .examine, .expose and .explain the black-box we provided? We’ve got some fun ideas to try out for yourself! Be sure to use the API Reference to figure out how to do them.
A. Which tokens are the most informative in distinguishing between the predicted classes?
Show hints
Try `help(box.explain.token_information)`B. Can I globally change the language to Dutch (‘nl’) if my data is Dutch?
Show hints
See `help(Explabox)`C. How do local explanations with LIME compare against scores with KernelSHAP?
Show hints
Try `box.explain.explain_prediction(..., methods=['lime', 'kernelshap'])`D. What happens if you change the l1 regularization of KernelSHAP?
Show hints
Try `box.explain.explain_prediction(..., methods=['kernelshap'], l1_reg=...)`E. How does the model perform if you repeat each sentence in the test set twice?
Show hints
Try `box.expose.compare_metrics(perturbation='repeat')`F. How does the model perform if you start each review with ‘This is a review.’?
Show hints
Try ```python from explabox.expose import OneToOnePerturbation perturbation = OneToOnePerturbation(lambda x: f'This is a review. {x}') box.expose.compare_metrics(perturbation=perturbation) ```G. Does adding random typos degrade model performance?
Show hints
Try ```python from explabox.expose.text import OneToOnePerturbation perturbation = OneToOnePerturbation(lambda x: f'{x}!!') box.expose.compare_metrics(perturbation=perturbation) ```H. Are there any drug names (https://www.drugs.com/drug_information.html) that seem to have more positive scores?